
【最后赢家】AI双向信号ETH合约2.0
Descrição do sinal
I kindly request all bosses to read the signal introduction carefully
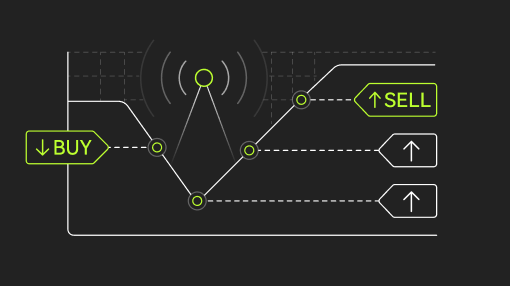
This is a trend-following breakout strategy that aims to capture volatility expansion while filtering out "cut-offs" of low momentum. The idea is that significant price movements usually break through the volatility band (Keltner channel) first, accompanied by volume and trend strength (ADX).
Strategy logic: Volatility breakout: The main trigger point is the close of the candlestick outside the Keltner channel. This indicates that the price is moving faster than the average range.
Trend Screening: Trades are only made after the correct direction has been taken.
Momentum Screening (ADX): ADX screening ensures that only entry is made when the trend strength is above a certain threshold. This prevents the strategy from buying tops or selling bottoms in volatile markets.
Volume Confirmation: A breakout without volume is often an illusion. This script requires volume to be above the moving average.
Risk Management (Automated): Stop Loss: Based on ATR (Average True Range) to adapt to current market fluctuations.
Trailing Stop: Once the trade is favorable, initiate a trailing stop to lock in profits.
Breakeven: If the price moves in favor of X%, the stop loss is automatically adjusted to the entry price to protect capital.
Cooldown: Includes a safety mechanism to prevent overtrading immediately after a signal.
The signal adopts a long-short compound interest strategy (non-multiple increase mode), the default investment amount is 40%, the leverage X1 order is placed, the average annual return of the 5-year data is 84.875% (2 times-298.41%, 3 times-812.12%), the maximum drawdown is 5.73% (2 times-11.3%, 3 times -16.7), the win rate is 55.56%, the profit-loss ratio is 2.164, and the average annual trading frequency is 114 times.
The boss needs to add leverage by himself, and if he does not double the leverage, he will increase the maximum drawdown by 5.73%, and it is forbidden to exceed X10 leverage!!
The longest wait-and-see period for backtesting data is 12 days, please wait patiently for the signal to trigger after subscribing, and do not be anxious
Aviso legal: o conteúdo acima foi traduzido automaticamente e destina-se apenas a fins informativos.
Mostrar no idioma original
Visão geral
PnL de subscritores (USDT)
-16,55
AUM (USDT)164,68
Taxa de sucesso de subscritores46,15%
Desencadeamentos nos últimos 7 dias5
Desempenho
30 dias
APY backtested a 30 d
--
Pares de negociação suportados
Perpétuos ETHUSDT
SímboloAPY backtestedRedução máxima 7D

Sem dados disponíveis
Detalhes de desencadeador do sinal
•A apresentação terá um atraso de 24 horas
Símbolo / data e horaTipo de entradaMontante por ordemAções
Perpétuos ETHUSDT
23/04/2026, 18:00:00
Contratos
539
Entrada curta
Perpétuos ETHUSDT
22/04/2026, 10:30:07
Sair de posição
100,00%
Saída curta
Perpétuos ETHUSDT
20/04/2026, 05:00:00
Contratos
580
Entrada curta
Perpétuos ETHUSDT
20/04/2026, 02:01:09
Sair de posição
100,00%
Saída curta
Perpétuos ETHUSDT
18/04/2026, 19:00:00
Contratos
537
Entrada curta
Perpétuos ETHUSDT
14/04/2026, 22:59:59
Sair de posição
100,00%
Saída longa
Perpétuos ETHUSDT
14/04/2026, 07:00:00
Contratos
1071
Entrada longa
Perpétuos ETHUSDT
14/04/2026, 03:53:09
Sair de posição
100,00%
Saída curta
Perpétuos ETHUSDT
12/04/2026, 21:00:00
Contratos
1217
Entrada curta
Perpétuos ETHUSDT
12/04/2026, 09:42:20
Sair de posição
100,00%
Saída longa
O que é o bot de sinais?
Um bot de sinais é uma abordagem ao trading executada por dados do mercado e indicadores técnicos. Efetua transações automáticas com base num número de sinais predefinidos, incluindo indicador técnico, movimentos de preço, índices de mercado, ou uma combinação de todos.